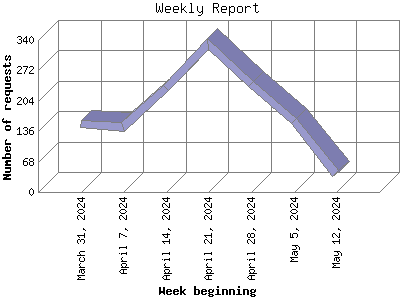
The Weekly Report identifies the activity for each week within the report
time frame. Remember that one page hit can result in several server requests
as the images for each page are loaded.
Note: Depending on the
report time frame for this report the first and last week may not represent
a full seven day week, resulting in lower hits.
| Week beginning | Number of requests | Percentage of the requests | |
|---|---|---|---|
| 1. | April 21, 2024 | 89 | 16.15% |
| 2. | April 14, 2024 | 165 | 29.95% |
| 3. | April 7, 2024 | 146 | 26.50% |
| 4. | March 31, 2024 | 151 | 27.41% |
Most active week beginning April 14, 2024 : 165 requests handled.
Weekly average: 137 requests handled.
This report was generated on April 25, 2024 02:18.
Report time frame April 1, 2024 00:05 to April 24, 2024 23:58.
| Web statistics report produced by: | |
 Analog 6.0 Analog 6.0 |  Report Magic 2.21 Report Magic 2.21 |