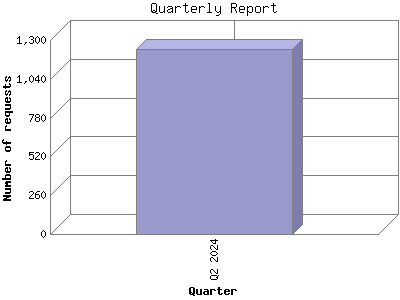
The Quarterly Report shows total activity on your site for each quarter of a
year. Remember that each page hit can result in several server requests as the
images for each page are loaded.
Note: Most likely, the first and
last quarters will not represent a complete quarter's worth of data, resulting
in lower hits.
| Quarter | Number of requests | Percentage of the requests | |
|---|---|---|---|
| 1. | Q2 2024 | 336 | 100.00% |
Most active quarter Q2 2024 : 336 requests handled.
Quarterly average: 336 requests handled.
This report was generated on April 16, 2024 06:05.
Report time frame April 1, 2024 00:01 to April 15, 2024 23:57.
| Web statistics report produced by: | |
 Analog 6.0 Analog 6.0 |  Report Magic 2.21 Report Magic 2.21 |