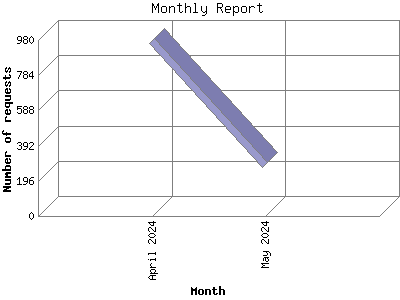
The Monthly Report identifies activity for each month in the report
time frame. Remember that each page hit can result in several server requests
as the images for each page are loaded.
Note: Depending on the
report time frame, the first and last months may not represent a complete
month's worth of data, resulting in lower hits.
| Month | Number of requests | Percentage of the requests | |
|---|---|---|---|
| 1. | April 2024 | 395 | 100.00% |
Most active month April 2024 : 395 requests handled.
Monthly average: 395 requests handled.
This report was generated on April 18, 2024 01:17.
Report time frame April 1, 2024 00:05 to April 17, 2024 23:44.
| Web statistics report produced by: | |
 Analog 6.0 Analog 6.0 |  Report Magic 2.21 Report Magic 2.21 |